Portfolio analysis

investment portfolio代写 The construction of investment portfolio is a perennial question in the analysis of financial investment. For years
Abstract investment portfolio代写
The construction of investment portfolio is a perennial question in the analysis of financial investment. For years, the academic field and the industrial field have proposed many ways to optimize the portfolio. The theory of Markowitz mean-variance model (M-V model) takes the primary place. In the first part, this report introduces a method of constructing an effective stock portfolio with M-V model to establish effective frontier by using R. In the second part, we have built a simple simulation trading system for one stock by using R.
Content
1 Construct portfolio ………………………………………………………………1
1 Introduction ………………………………………………………………………..1
1.2 portfolio construction ………………………………………………………..2
1.3 evaluation …………………………………………………………………………3
2 trading system ……………………………………………………………………..4
2.1 methodology ……………………………………………………………………..4
2.2 a trading system with one MA line ………………………………………4
2.3 a trading system with two MA lines ……………………………………..6
3 conclusion …………………………………………………………………………….7
References ………………………………………………………………………………8
1 Construct portfolio
1.1 Introduction investment portfolio代写
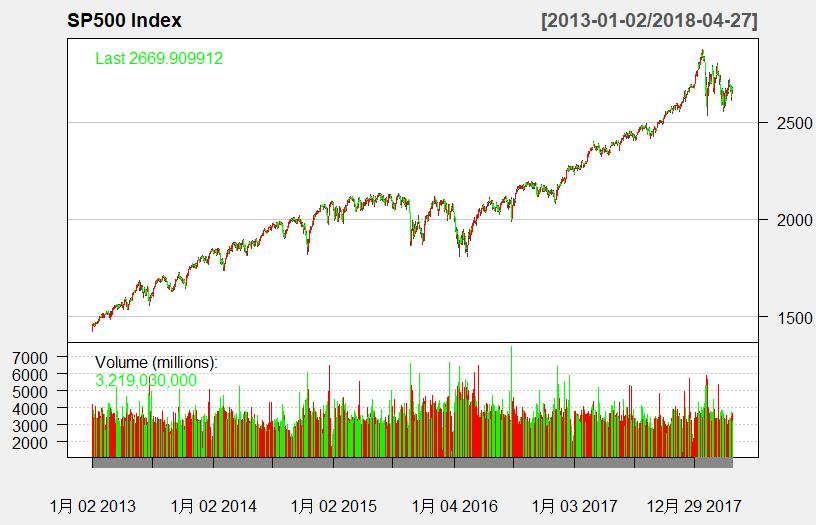
The Standard & Poor’s 500 (abbreviated as S&P500), is an American stock market index based on the market capitalizations of 500 large companies having common stock listed on NYSE or NASDAQ. The S&P500 index has experienced a circle of bull market and bear market since 2013. So our sample encompasses a over 5-year period from January 2013 to April 2018.
1.2 portfolio construction
Companies like GOOGLE, IBM, MICROSOFT, APPLE and FACEBOOK are labeled as IT constitutes of S&P500 components. Companies like AFFIL MANAGERS, GOLDMAN SACHS, Citi Group, NASDAQ and MOODYS are labeled as financial constitutes of S&P500 components.Portfoliod代写
By R command getSymbols(), we get the historical market data of the ten stocks mentioned above and S&P500 index from yahoo finance website.
Supposing that one company can continue operating for more than 10 years, so we take 10-year US treasury interest rate as risk-free rate.
For simple, we construct two equal weighted portfolios:

The correlation matrix of IT stocks and S&P500 is listed as below.
GOOG/ MSFT/AAPL/FB are highly correlated with each other, IBM is negative correlated with other 4 stocks.
| GOOG | IBM | MSFT | AAPL | FB | SPY | |
| GOOG | 1.00 | -0.23 | 0.98 | 0.89 | 0.97 | 0.95 |
| IBM | -0.23 | 1.00 | -0.19 | -0.29 | -0.31 | -0.21 |
| MSFT | 0.98 | -0.19 | 1.00 | 0.92 | 0.96 | 0.97 |
| AAPL | 0.89 | -0.29 | 0.92 | 1.00 | 0.93 | 0.97 |
| FB | 0.97 | -0.31 | 0.96 | 0.93 | 1.00 | 0.97 |
| SPY | 0.95 | -0.21 | 0.97 | 0.97 | 0.97 | 1.00 |
1.3 evaluation
The capital asset pricing model(CAPM), derived by Sharpe, Lintner and Mossin, is one of the most celebrated models in all of finance. The model describes the relationship we should expect to see between risk and return for individual assets. Specifically, the CAPM provides a way to calculate an asset’s expected return (or “required” return) based on its level of systematic (or market-related) risk, as measured by the asset’s beta.
For a portfolio, the equation for CAPM is
![]()
Which is the risky free rate, stands for the return of market, represents the sensitivity of the portfolio’s return to the market return.
Through linear regression, R command without intercept , we can get the beta of two portfolios:

Beta is considered as the systematic risk, in a diversified portfolio, an investor should only be compensated for systematic risk (or beta) exposure. Beta reflects the relationship between the portfolio and the whole market. If beta is larger than 1, the portfolio earns more when the market goes up. If beta is smaller than 1, the portfolio loses less when the market goes down.
Form the linear regression results, we can see portfolio 1 and portfolio 2 both have beta greater than 1. When the market goes up, the portfolios will earn more than the market.
Future, we want to calculate the efficient frontier. take portfolio 1 as example.
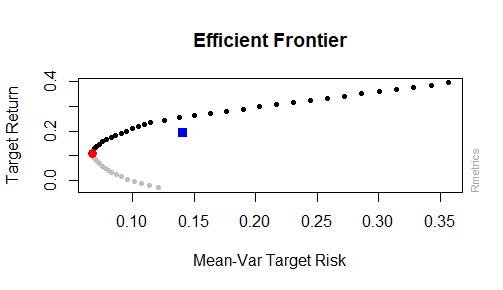
the efficient frontier is shown as below, the red point represents the minimum risk portfolio, the blue point represents the equal weights portfolio. it’s obvious that equal weights portfolio is not on the efficient frontier.
2 trading system investment portfolio代写
2.1 methodology
Moving average(MA) line is the most common technical analysis method in stock market. People use MA to look for trading signals in stock market. MA is simple and effective. In technical analysis field, moving average line is a necessary index tool. There are 3 main moving average line in application.
- Simple moving average (SMA)
- Weighted moving average(WMA)
- Exponential moving average(EMA)
MA line are always smoothness, we can see there are some crosses between MA line and candlestick charts. those crosses will help us to judge trading signals whether to buy or to sell. In this report, we want to trade GOOGLE for example.
2.2 a trading system with one MA line
The main design thought:
1) if the close price of the stock up-cross the 20-day MA line, buy it
2) if the close price of the stock down-cross the 20-day MA line, sell it
At first, we write our own moving average function ma(), and the custom function about drawing moving average lines drawLine().
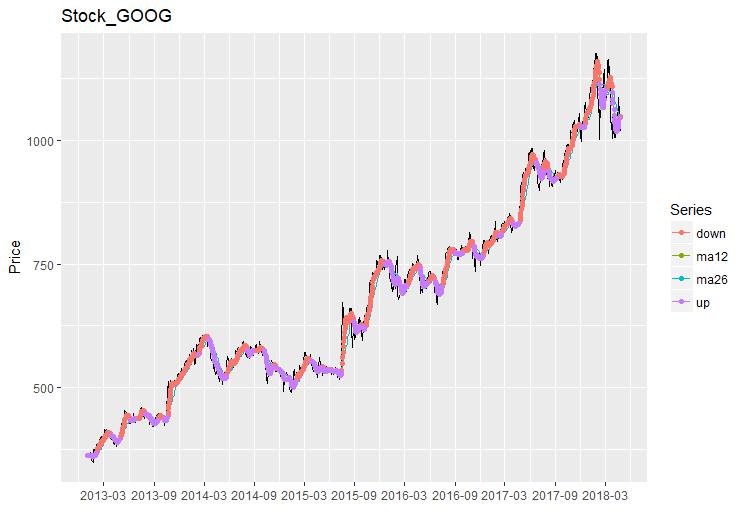
The MA20 lines are defined on the barchart of GOOGLE.
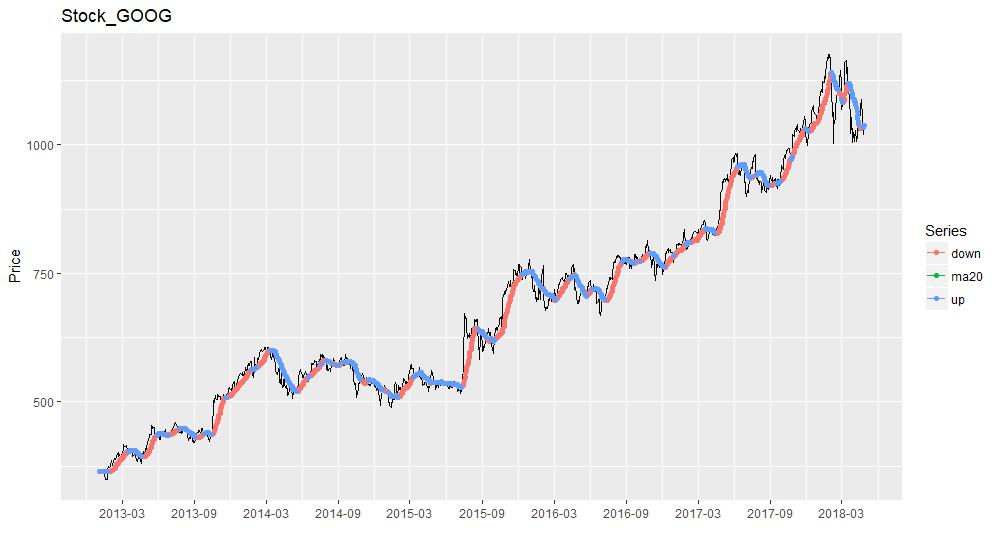
drawPoint() function will mark the holding times and empty times with different color. Then we can see that when close price is less than MA20, will be shown in red, when close price is greater than MA20, will be shown in blue. Then we can buy in the stock when the first red point occurs, and sell out the stock when the first blue point occurs. This process will come to a simple trading system.investment portfolio代写
Then we try to find out those trading points and calculate whether the tradings actually earn money or loss money. The function signal() and trade() are designed to find out this question. we find that there are 154 times trading logs, half is the buy actions.
Set initial capital equals 1 million, suppose that we fully invested at all times, and with no trade cost. Through simulation trading, we can actually calculate the performance the strategy.
> tail(result1$ticks,1)
Value op cash amount asset diff
2018-04-26 1040.04 B 715.5761 168 175442.3 0
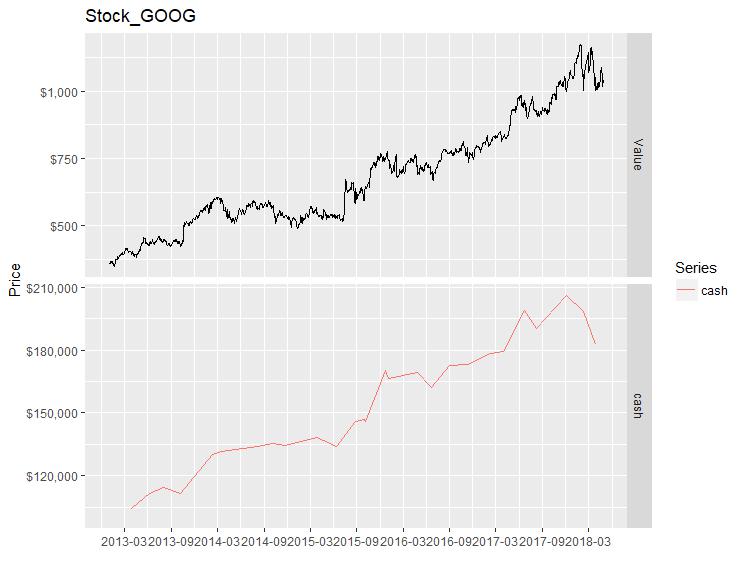
Through the above output, we can know that on 2018-04-26, the strategy suggests to buy in, and the total profit is 75442.3. the number of profit operations is 24, the number of loss operation is 52. Why we still earn money in the end? We draw the cash flow over the whole trading period shown below.
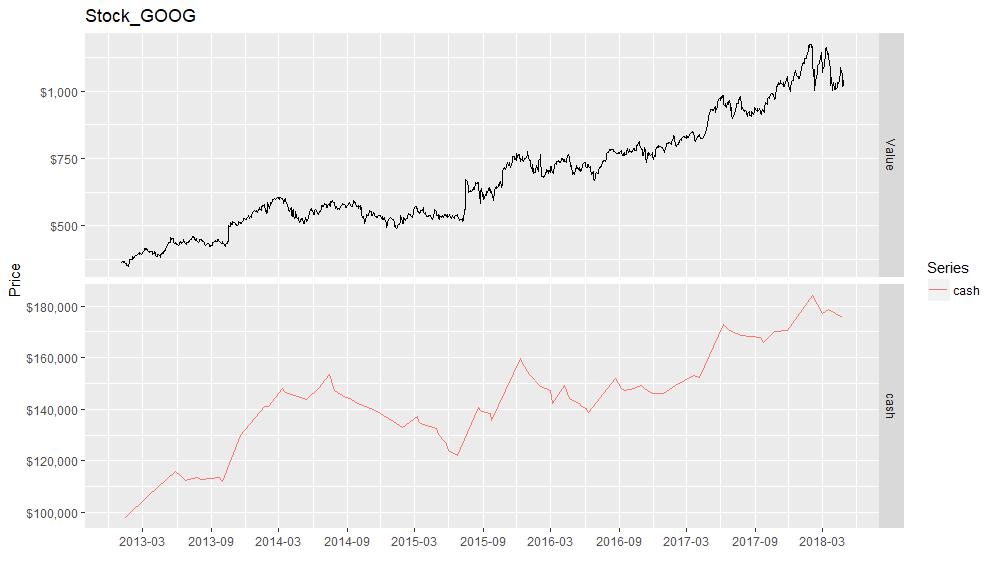
In the long going-up trends, the trading operations have earned a lot of money. But when the market is fluctuated, the strategy will loss efficacy and have a big drawdown, which can be seen during 2014-03 ~ 2015-06. The maxdrawdown is 31%.
2.3 a trading system with two MA lines
One moving average line will earn money during long going-up trends. but we must realize that one MA line system is very sensitive to fluctuations. If small fluctuations are too frequent, not only will the number of transactions be increased, but the model will fail.
We introduce this method, some like one MA line.
1)Get MA12, MA26
2)If MA12 up-cross MA26, buy (gold cross)
3)If MA12 down-cross MA26, sell (dead cross) investment portfolio代写
Still take GOOGLE as the test sample. We count that there are 18 times trading ended with profit, and 10 times trading ended with loss. two-line will reduce the number of signal.
> tail(result2$ticks,1)
Value op cash amount asset diff
2018-04-24 1019.98 B 277.5063 179 182853.9 0
The final P&L is 82853.9. two-line system produces less trading signal than one-line system. The maxdrawdown is 23%, which is smaller than the one-line system. Two-line system is more stable than one-line system.investment portfolio代写
3 conclusion investment portfolio代写
In this report, we compare different portfolios with CAPM, the IT portfolio and finance portfolio are both outperform S&P500 index. We build a simple trading system with moving average lines. To simplify the processing, we assume no transaction costs, and this system only trade one stock. If we want to trade a set of stock, we should do more work to develop the program.
References
https://en.wikipedia.org/wiki/Modern_portfolio_theory
https://en.wikipedia.org/wiki/Moving_average
Zhang Dan, R geeks’ ideal for advanced developer, 2015, China Machine Press
更多其他:prensentation代写 文学论文代写 商科论文代写 艺术论文代写 人文代写 Case study代写 心理学论文代写 哲学论文代写


您必须登录才能发表评论。