
stats project代写 The population we want to compare are performance in exams of students whose race/ethnicity are grouped B/C/D.

Part 1
Introduction stats project代写
The population we want to compare are performance in exams of students whose race/ethnicity are grouped B/C/D.
Complete data can download from
https://www.kaggle.com/spscientist/students-performance-in-exams. This dataset includes scores from three exams and a variety of personal, social, and economic factors that have interaction effects upon them. There are three quantitative variables and five categorical variables. Group B has 190 records, group C has 329 records, group D has 262 records.
Qualitative variables we observed were “gender” and “parental level of education”. “gender” male means students are male, “gender” female means students are female. “parental level of education” gives the level of education of students’ parents.
Quantitative variables we observed were “math score” / “reading score”/ “writing score” which are relative exam scores.
Part 2
Sample and collect data stats project代写
We use simple random sampling without replacement to get the subset of the complete dataset.
Step1: add a column as id number series for each group B/C/D.
Step2: use Sampling tool that’s part of the Data Analysis command, set id number column as the input range, then remove the replicate items, make sure the sample size is 30.
Frequency Tables and Pie Charts
For each qualitative variable, make a frequency table and a pie chart.
1) gender
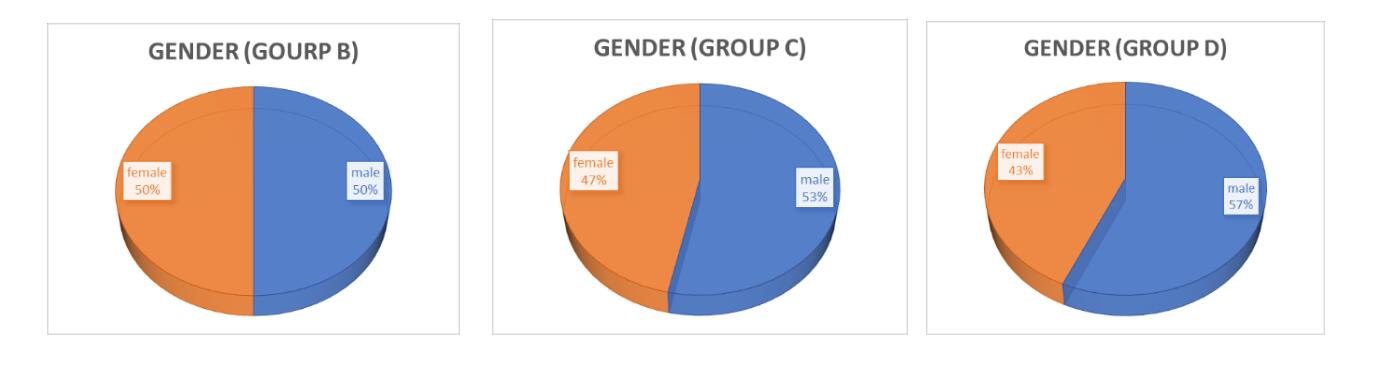
The pie chart above show the gender of the 30 students exam records sampled from race group B/C/D. we can see that the number of female students are equal with the number of male students in group B samples, the number of female students are less than the number of male students in group C and group D samples.
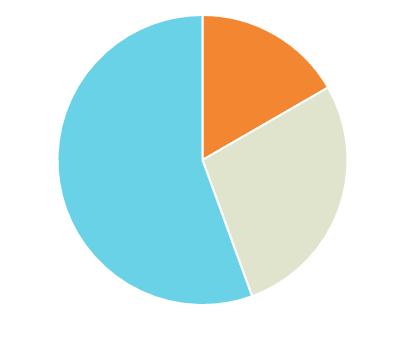
2) parental level of education stats project代写
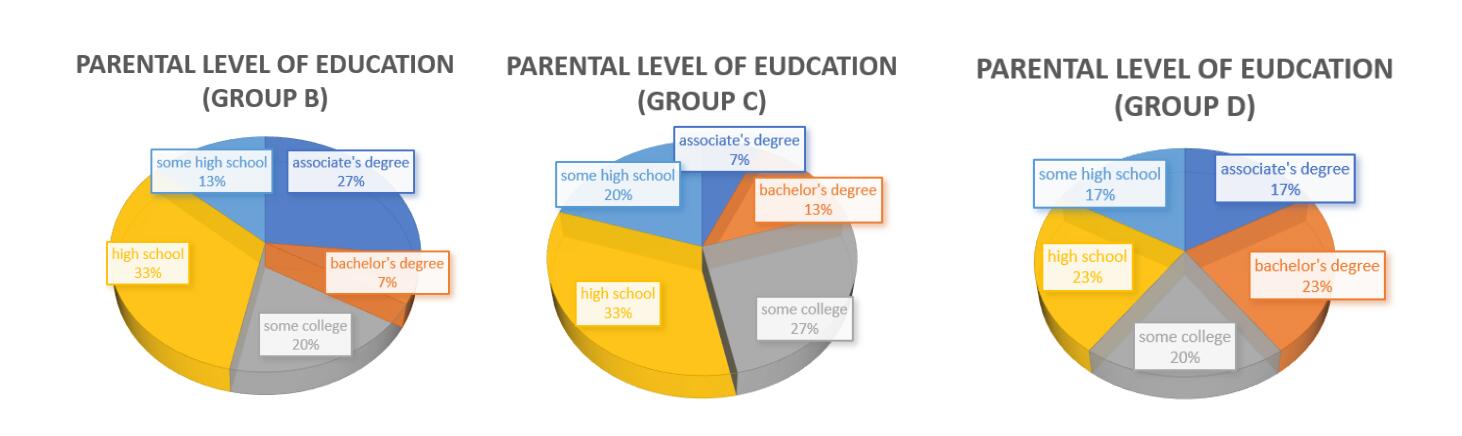
The pie charts above show parental level of education of the 30 samples from race group B/C/D. we can see that student’s parental level of education in group D has the highest proportion of bachelor’s degree. High school proportions are same in group B and group C.
Part 3
Box Plot
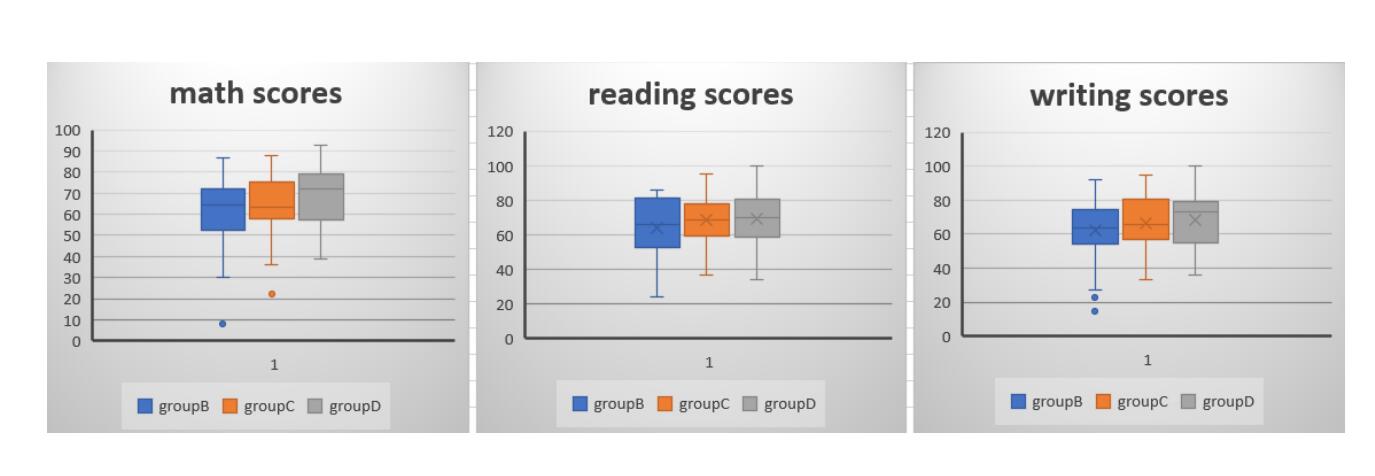
The boxplots above to the left shows the math scores of the 30 students sampled from race group B, group C, and group D. The boxplots show that group C has the least variation in math scores, while group D has the largest variation in math scores. Also, we can see that the medium math score of group D is higher than that of group B and group C.
The boxplots above in the center show the reading scores of the 30 students sampled from race group B, group C and group D. the boxplots show that group B has the largest variation. Once again, the median reading score of group D is higher than that of group B and group C.
The boxplots above in the right show the writing scores of the 30 students sampled from race group B, group C and group D. the boxplots show that the group B has the smallest variation. Once again, the median writing score of group D is higher than that of group B and group C.
Recall that the parental level of education in subgroup C have the highest proportion in bachelor’s degree, maybe students who parents with higher education are more likely to get higher score in their own exams.
Part 4
Inferential Analysis stats project代写
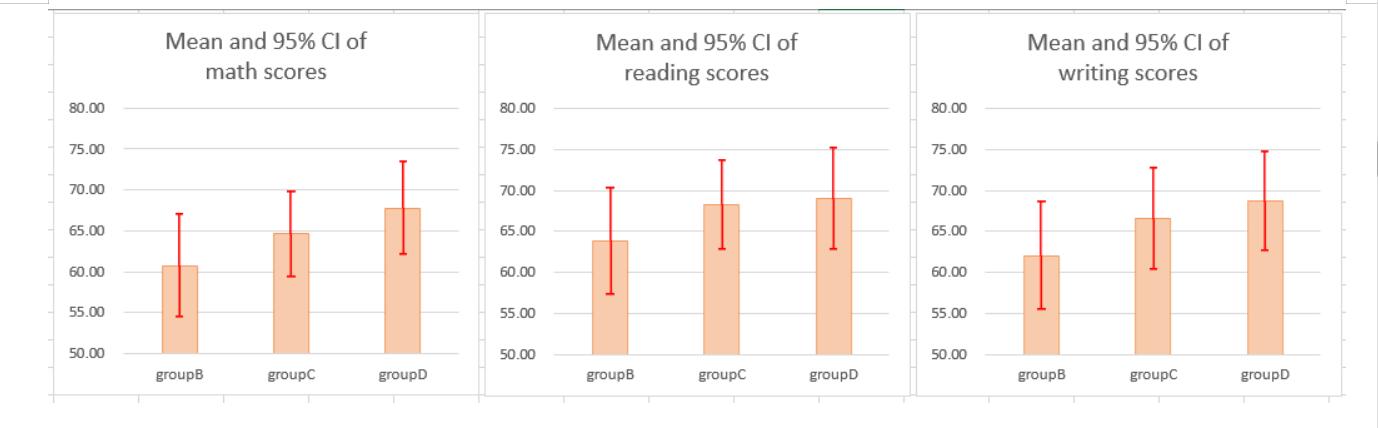
The table below shows the mean, standard deviation, and the mean’s margin of error for each quantitative variables and population. The margins of error are calculated using a normal distribution and a 95% confidence level.
| population | groupB | groupC | groupD | |
| math scores | mean | 60.77 | 64.63 | 67.80 |
| standard deviation | 17.43 | 14.46 | 15.79 | |
| margin of error | 6.24 | 5.17 | 5.65 | |
| reading scores | mean | 63.87 | 68.33 | 69.03 |
| standard deviation | 18.14 | 15.10 | 17.18 | |
| margin of error | 6.49 | 5.41 | 6.15 | |
| writing scores | mean | 62.07 | 66.57 | 68.73 |
| standard deviation | 18.50 | 17.22 | 17.00 | |
| margin of error | 6.62 | 6.16 | 6.08 |
The charts below show the means and confidence intervals for each quantitative variables and population. Assuming a normal distribution of sample means, there is a 95% probability that the true mean of a population lies within the confidence interval shown for it.
Part 5
Hypothesis Testing stats project代写
1) Variation of reading scores in group B and group C.
It appears from the boxplot that the variation among the reading scores in group B is less than that of in group C. Also, the standard deviation of reading scores in group B sample is 15.10, while the standard deviation of reading scores in group C sample is 18.14.
To see whether this is a statistically significant finding at the 5% level of significance, an F-stat was performed.
We use the “F-test two sample for Variances” command in Data Analysis. then we get the following table:
| F-Test Two-Sample for Variances | ||
| Variable 1 | Variable 2 | |
| Mean | 63.87 | 68.33 |
| Variance | 329.22 | 228.16 |
| Observations | 30 | 30 |
| df | 29 | 29 |
| F | 1.44 | |
| P(F<=f) one-tail | 0.16 | |
| F Critical one-tail | 1.86 | |
The result show p-value for test is 0.16, so we don’t have enough evidence to reject the null hypothesis that reading scores of group B and group C’s variances are same at the 5% level of significance.
2) mean of reading scores in group B and group C. stats project代写
Further, the mean value of reading scores in group B and group C respectively are 63.87 and 68.33. we want to see whether this is a statistically significant finding at 5% level of significance. Then a two-sample t-test is conducted.
By using the “t-Test: Two-Sample Assuming Equal Variances” command in Data Analysis, we can get the following result:
| t-Test: Two-Sample Assuming Equal Variances | ||
| Variable 1 | Variable 2 | |
| Mean | 63.87 | 68.33 |
| Variance | 329.22 | 228.16 |
| Observations | 30 | 30 |
| Pooled Variance | 278.69 | |
| Hypothesized Mean Difference | 0 | |
| df | 58 | |
| t Stat | -1.04 | |
| P(T<=t) one-tail | 0.15 | |
| t Critical one-tail | 1.67 | |
| P(T<=t) two-tail | 0.30 | |
| t Critical two-tail | 2.00 | |
The results above show that the p-value one tail for testing is 0.15, also, we don’t have enough evidence to reject the null hypothesis that there is no significant difference between the mean reading score in group B and the mean reading score in group C.
3) Mean math score of group A and group C stats project代写
Same as 1) and 2), we first conduct the variance testing using F-test, then using T-testing to test the mean of two sample.
The testing result are listed as below:
|
F-Test Two-Sample for Variances |
||
| Variable 1 | Variable 2 | |
| Mean | 60.77 | 67.80 |
| Variance | 303.98 | 249.20 |
| Observations | 30 | 30 |
| df | 29 | 29 |
| F | 1.22 | |
| P(F<=f) one-tail | 0.30 | |
| F Critical one-tail | 1.86 | |
| t-Test: Two-Sample Assuming Equal Variances | ||
| Variable 1 | Variable 2 | |
| Mean | 60.77 | 67.80 |
| Variance | 303.98 | 249.20 |
| Observations | 30 | 30 |
| Pooled Variance | 276.59 | |
| Hypothesized Mean Difference | 0 | |
| df | 58 | |
| t Stat | -1.64 | |
| P(T<=t) one-tail | 0.05 | |
| t Critical one-tail | 1.67 | |
| P(T<=t) two-tail | 0.11 | |
| t Critical two-tail | 2.00 | |
The results shows that at the significance level 0.05, the mean math score of group B are equal with the mean score of group D.
Appendix-Sample Data stats project代写
Group B
| gender | race/ethnicity | parental level of education | lunch | test preparation course | math score | reading score | writing score |
| male | group B | some college | free/reduced | none | 40 | 43 | 39 |
| female | group B | some college | free/reduced | completed | 65 | 75 | 70 |
| male | group B | associate’s degree | standard | none | 65 | 54 | 57 |
| male | group B | some high school | standard | none | 67 | 64 | 61 |
| female | group B | associate’s degree | standard | none | 47 | 49 | 50 |
| female | group B | some college | standard | none | 79 | 86 | 92 |
| male | group B | high school | standard | completed | 60 | 44 | 47 |
| female | group B | high school | standard | completed | 68 | 83 | 78 |
| male | group B | some high school | standard | completed | 61 | 56 | 56 |
| male | group B | associate’s degree | standard | none | 87 | 85 | 73 |
| female | group B | some high school | standard | none | 37 | 46 | 46 |
| male | group B | associate’s degree | free/reduced | none | 67 | 62 | 60 |
| female | group B | some college | free/reduced | none | 61 | 68 | 66 |
| female | group B | bachelor’s degree | standard | none | 61 | 72 | 70 |
| female | group B | associate’s degree | standard | none | 80 | 86 | 83 |
| female | group B | high school | free/reduced | none | 50 | 67 | 63 |
| male | group B | associate’s degree | standard | completed | 65 | 65 | 63 |
| female | group B | associate’s degree | free/reduced | none | 53 | 70 | 70 |
| male | group B | some college | standard | completed | 71 | 75 | 70 |
| male | group B | high school | free/reduced | none | 30 | 24 | 15 |
| female | group B | bachelor’s degree | standard | completed | 65 | 81 | 81 |
| female | group B | some high school | free/reduced | completed | 59 | 63 | 64 |
| male | group B | high school | standard | completed | 76 | 62 | 60 |
| female | group B | high school | standard | completed | 77 | 82 | 89 |
| male | group B | associate’s degree | standard | completed | 82 | 84 | 78 |
| female | group B | high school | free/reduced | none | 64 | 73 | 71 |
| male | group B | high school | free/reduced | none | 36 | 29 | 27 |
| male | group B | high school | standard | none | 82 | 82 | 80 |
| male | group B | some college | free/reduced | completed | 60 | 62 | 60 |
| female | group B | high school | free/reduced | none | 8 | 24 | 23 |
group C stats project代写
| gender | race/ethnicity | parental level of education | lunch | test preparation course | math score | reading score | writing score |
| female | group C | some college | free/reduced | none | 76 | 83 | 88 |
| male | group C | some high school | free/reduced | completed | 53 | 37 | 40 |
| female | group C | associate’s degree | standard | none | 59 | 66 | 67 |
| female | group C | some college | free/reduced | none | 22 | 39 | 33 |
| male | group C | some high school | free/reduced | completed | 59 | 69 | 65 |
| female | group C | some college | standard | completed | 88 | 95 | 94 |
| female | group C | some high school | standard | completed | 85 | 92 | 93 |
| male | group C | some high school | standard | none | 51 | 52 | 44 |
| male | group C | high school | standard | none | 71 | 66 | 65 |
| female | group C | high school | free/reduced | completed | 67 | 79 | 84 |
| female | group C | bachelor’s degree | standard | none | 83 | 93 | 95 |
| female | group C | some college | standard | completed | 63 | 78 | 80 |
| male | group C | some high school | free/reduced | none | 69 | 71 | 65 |
| male | group C | high school | standard | none | 61 | 56 | 55 |
| female | group C | some college | standard | none | 84 | 87 | 91 |
| male | group C | some college | free/reduced | none | 68 | 68 | 61 |
| female | group C | high school | free/reduced | none | 36 | 53 | 43 |
| male | group C | associate’s degree | standard | completed | 51 | 60 | 58 |
| male | group C | high school | standard | completed | 75 | 69 | 68 |
| female | group C | some college | free/reduced | completed | 63 | 73 | 71 |
| male | group C | some college | standard | none | 53 | 39 | 37 |
| female | group C | high school | standard | none | 81 | 84 | 82 |
| male | group C | high school | standard | none | 62 | 67 | 58 |
| female | group C | high school | standard | completed | 60 | 64 | 74 |
| male | group C | some high school | standard | none | 64 | 58 | 51 |
| male | group C | bachelor’s degree | standard | completed | 63 | 64 | 66 |
| male | group C | high school | free/reduced | none | 54 | 72 | 59 |
| female | group C | bachelor’s degree | free/reduced | none | 67 | 75 | 72 |
| male | group C | bachelor’s degree | free/reduced | completed | 70 | 75 | 74 |
| male | group C | high school | standard | none | 81 | 66 | 64 |
Group D stats project代写
| gender | race/ethnicity | parental level of education | lunch | test preparation course | math score | reading score | writing score |
| male | group D | associate’s degree | standard | none | 40 | 52 | 43 |
| male | group D | bachelor’s degree | free/reduced | completed | 74 | 71 | 80 |
| female | group D | some college | standard | none | 69 | 74 | 74 |
| male | group D | high school | standard | none | 88 | 78 | 75 |
| male | group D | some high school | free/reduced | none | 45 | 37 | 37 |
| male | group D | bachelor’s degree | free/reduced | completed | 74 | 79 | 75 |
| male | group D | some high school | free/reduced | completed | 80 | 79 | 79 |
| male | group D | some college | standard | none | 76 | 64 | 66 |
| male | group D | associate’s degree | standard | none | 80 | 75 | 77 |
| female | group D | associate’s degree | standard | completed | 88 | 92 | 95 |
| female | group D | bachelor’s degree | standard | none | 59 | 70 | 73 |
| female | group D | some college | standard | none | 77 | 68 | 77 |
| male | group D | associate’s degree | standard | none | 71 | 66 | 60 |
| female | group D | bachelor’s degree | standard | none | 79 | 89 | 89 |
| female | group D | associate’s degree | free/reduced | none | 52 | 59 | 56 |
| male | group D | some high school | free/reduced | none | 62 | 49 | 52 |
| female | group D | some college | standard | none | 74 | 89 | 84 |
| male | group D | high school | free/reduced | none | 60 | 57 | 51 |
| male | group D | high school | standard | none | 46 | 34 | 36 |
| male | group D | high school | standard | none | 89 | 87 | 79 |
| female | group D | high school | free/reduced | none | 73 | 92 | 84 |
| female | group D | some high school | free/reduced | completed | 40 | 65 | 64 |
| male | group D | bachelor’s degree | free/reduced | completed | 39 | 42 | 38 |
| male | group D | some high school | standard | completed | 88 | 74 | 75 |
| female | group D | bachelor’s degree | free/reduced | completed | 93 | 100 | 100 |
| male | group D | bachelor’s degree | free/reduced | none | 50 | 42 | 48 |
| male | group D | high school | free/reduced | none | 74 | 70 | 69 |
| female | group D | high school | free/reduced | completed | 65 | 61 | 71 |
| female | group D | some college | standard | none | 62 | 70 | 72 |
| female | group D | some college | free/reduced | completed | 67 | 86 | 83 |
更多其他: 数据分析代写 Assignment代写 Case study代写 文学论文代写 商科论文代写 艺术论文代写 人文代写 心理学论文代写 哲学论文代写 计算机论文代写


您必须登录才能发表评论。